we give information a buisness meaning
9th International Controlling Conference
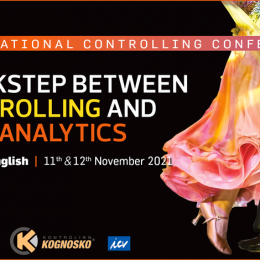
Quickstep between Controlling and Data Analytics


9th International Controlling Conference in Croatia (ICCC)
Quickstep between Controlling and Data Analytics
Thursday and Friday, 11th -12th November 2021, 10:00 CET (UTC+1), online via YouTube
This is a global invitation to the great Controlling event
ORGANIZERS: Consulting company Kontroling Kognosko and Lider media
ENDORSEMENT: ICV International Controller Verein
OFFICIAL LANGUAGE: English
We invite you to the 9th International Controlling Conference in Croatia (ICCC), which will be held on Thursday and Friday, 11th -12th November 2021 online via YouTube.
The theme is inspired by the rapid development of data analytics which undoubtedly influences the direction of traditional controlling towards new areas. The most important task is transforming millions of data into a few precious words of wisdom!
Data analytics is making great progress right in front of our eyes and traditional controlling now needs to embrace it as a new partner. These two disciplines cannot succeed without each other, without mutual understanding and harmony. And we can only reap the benefits if both controlling and data analytics engage in a perfect dance.
This year we have gathered leading experts from Switzerland, Germany, Australia, Austria, France, Czech Republic, Poland, and Croatia to tackle these two amazing topics – Controlling and Data Analytics.
During the two-day event, 14 different topics will be covered, and we expect participants from literally all over the world!
Your host will be Jasmina Očko, a controlling consultant and trainer.
The conference will not be recorded. The official language of the conference is English.
What to expect?
Next-level controlling!
Data analytics is a specific set of techniques, competencies, and procedures whose goal is to gain much more insight into the business. It involves collecting, examining, refining, transforming, and modeling data in order to evaluate and predict future business flows based on trends, causality, and numerous other factors.
The development of analytical tools gave rise to a field in which change management is easier than ever thanks to digital technologies.
Our speakers prepare for you their presentations just on these topics!
What inspired us?
Our obsession with data.
Data can be transformed into information only if we give it structure and process it in the right way. Yet, having a piece of information is not a goal in itself. For it to be useful, it has to bring new knowledge. And new knowledge can only be created by a skillful controller through analysis and the use of controlling tools and skills.
However, this still does not guarantee that the knowledge that was acquired will be used adequately. It takes a competent and talented manager, one well-versed in business, to obtain a good result in the end.
Talent, ability, and skill play a crucial role at every level, and we will do our best to convince you of that.
Who is the Conference for?
This two-day conference has been designed to meet the expectations of:
All levels of controllers, planners, data scientists, data analytics, company owners, top managers, sales, marketing, purchasing, production managers, IT experts who work on business solutions that provide support to controlling (BI, DW, planning), financial and accounting managers and all others who feel a new era is knocking at the door.
Details to keep in mind:
- You can only register for both days of the conference
- All communication will be in English
- The conference can be accessed only by participants who have made a payment and only one person per link can participate
- Cancellation with a refund or a change of order are possible up to 24 hours prior to the conference
- The conference will be accessible 30 minutes before the start
- Participants will be able to ask questions in writing to the lecturers, who will answer in writing after their presentation
- A link to all presentations will be sent to the participants after the conference
- Presentations and speeches will not be recorded
Organizers: Kontroling Kognosko and Lider media in cooperation.
Contacts:
Kontroling Kognosko – www.kognosko.hr
- Jasmina Očko / Programme manager / jasmina.ocko@kognosko.hr / Phone: 0038591 780 66 28
- Renato Očko / Project manager / renato.ocko@kognosko.hr / Phone: 0038598 361 856
Lider media d.o.o. – lider.media
- Tina Kovačić / event manager / tina.kovacic@lider.media.hr / Phone: 0038591 460 45 56
Basics
Information
Program
program
2.37 MB, pdf
Storytelling with business data
Why do we create bad charts and ineffective visuals? Why do we tell exciting stories to our friends but give a boring set of numbers at work presentations? If you have ever created a chart in Microsoft Excel, then you should attend. If you have created a chart in any other tool, then you should definitely attend. This is not an Excel manual; this presentation is about applying principles of storytelling to your business data visualizations, regardless of the tool. During this short presentation, you will learn what makes a good chart and I will l give you a step-by-step recipe for creating a good chart. You will make a shift from just showing the data to actual visual storytelling!

Predictive analytics in management forecasts: The role of social ties and local knowledge
Forecasts are supposed to provide an organization with the best estimate of future performance. They are essential for steering businesses in dynamic environments and managing relations with external stakeholders. However, they are often compromised by a lack of judgement and expertise as well as an individual's motivation and cognitive biases. Despite mechanisms to improve the forecasting process, such as accuracy incentives or the use of management accountants, forecasts have often been considered as biased and the forecasting process with all its checks and balances as cumbersome and inefficient. Algorithm-based calculations such as predictive analytics have been proposed as a promising alternative to forecasts that rely on human intelligence. However, these forecasts are not perfect either. They tend to be perceived as black boxes that do not provide enough information about what is driving the forecast, which reduces their acceptance and actionability. Furthermore, algorithms rely on historic data and might not incorporate recent or highly tacit — or implied — information. In a context of structural changes and extraordinary events, human judgement might be better suited to produce a fairly accurate forecast.
Against that backdrop, this presentation is on a recent research project that has focused on how predictive forecasting can impact corporate control. The research project investigated how companies use predictive analytics to produce more neutral and unbiased forecasts. More specifically, we explored the interplay of forecasting experts and algorithm-based calculations to analyze how algorithm-based forecasts come to be trusted.
We show how, particularly in rather dynamic environments, it is necessary to incorporate local knowledge into corporate predictive forecasts and consider how this affects the way organizations talk about and do forecasting. Based on this observation, we argue that the implementation and use of predictive analytics in management accounting is a technical but also a social practice. In addition, we discuss how the introduction of algorithmic calculations might also be helpful for driving digitalization across decentralized business units, and, in doing so, paves the way for an increasing penetration of technology across the whole organization.

Data challenges
The story of how Group reporting was developed at Orbico. We began by standardizing master data, mapping data, and adding group dimensions. Our goal was to obtain a uniform overview of all the companies in the group. We faced a lot of obstacles, such as different systems, applications, data structures and data mess. This is still an ongoing issue. After consolidating a large amount of data, we began creating standard reports and working on automatization and, whenever possible, adding more data. With enough data in place, we were able to compare and analyse it. New issues arose, such as data complexity and too much disconnected data coming from different sources. Data challenges are always present and resolving them is an ongoing process. If you want to have a flexible organization, you need to adjust to new circumstances all the time. The role of controlling is to give data meaning and establish constant communication with business. The aim is to meet business needs under rapidly changing circumstances, and to do this with the help of data.


Liquidity planning under uncertainties
Luiza and Jörn will present Liquidity Model created by them during their ICV international working group project carried our last year 2020. They used the power of Monte Carlo Simulation that is not a new tool but they found it still modern and very rarely used on a daily basis in companies.


Lunch Break
Customer profitability analysis
• Who is the right customer • How to create a customer financial profit • How to manage a win-win relationship with your customers in pandemic situation
3rd rock from the Sun – understanding data science as a controller
Try and fail and learn and try and learn and deploy and learn and...it is not the “3rd rock from the sun”. Hospital managers do not have an easy task. They increasingly have to address the issue of reductions in patient hospital stays and the transfer of inpatient care to the outpatient setting. This should prevent inadequate expenditure and avoidable expenses, but also bring benefits for patients (reduction in infection rates and psychological stress caused by hospitalization, more rapid return to their home environment). After creating SWOT and stakeholder analyses, the next goal is to create a classification model to help identify emergency department patients who will return. This allows staff to better allocate their resources and the ambulance transport to better plan their service. Finally, a demonstration of how project management is designed for this purpose will be given. A mixture of agile and classic approaches is best suited for this - a predefined plan that may be adapted and rewritten. 1. What did you fail at? 2. What lessons did you learn from the experience?

Big green data: How controllers can use data analytics to drive sustainability throughout the organization
How can controllers help their organizations be more sustainable? Data analytics-based tools can help people make better decisions and most importantly, make decisions easier rather than harder. Our presentation focuses on a people-centered approach to analytics and an analytics-based approach to sustainability. This powerful combination can help controllers create and support change in this area of critical business and social importance. We identify several analytics-based approaches to improve transparency and enhance results across all three components of the triple-bottom line approach. Additionally, we introduce a set of accessible tools that controllers can use to integrate sustainability and analytics into their work, concluding with some concrete action items that will hopefully be useful to conference participants.


End of day 01
Featured
Media
Lider media d.o.o.
Trg žrtava fašizma 6, 10000 Zagreb
tel: +385 (1) 6333 500
- Bojana Božanić Ivanović (direktorica)
- bojana.bozanic@lidermedia.hr
Marketing
- Krešimir Grgić (direktor)
- kresimir.grgic@lidermedia.hr
- Jelena Jagić
- jelena.jagic@lidermedia.hr
- Lucija Stipetić
- lucija.stipetic@lidermedia.hr
- Antonela Tandarić Kukoleča
- antonela.tandaric@lidermedia.hr
tel: +385 (1) 6333 537
Registration fees and Subscription
konferencije@lidermedia.hr
- Ivana Tomljanović (voditeljica odjela)
- ivana.tomljanovic@lidermedia.hr
- pretplata@lidermedia.hr
tel: +385 (1) 6333 536
Business
meetings
- Tomislav Blagaić
- tomislav.blagaic@lidermedia.hr
- Nataša Dević
- natasa.devic@lidermedia.hr
- Tina Kovačić
- tina.kovacic@lidermedia.hr
tel: +385 (1) 6333 500


